As we approach year end and stats numbers start to fly — keep in mind the following:
Days on Market Calculations:
Following conversion, the Days on Market numbers in Paragon have been calculated from List Date to Close Date. This is different than how they have historically been done (from List Date to Contract Date).
Paragon has an open work order and will be implemented a change to recast ALL DOM numbers in the MLS using the more traditional formula in our market of List Date to Contract Date. More information will be published closer to implementation of this fix. (The Skinny and 10K reports continue to use the DOM calculation of List Date to Contract Date).
End of Year Numbers: DO NOT USE OFFICE VOLUME RANKING REPORTS!
We have received a number of calls from users trying to run year-end numbers using office volume ranking reports. In Paragon these reports limit activity to ONLY LISTINGS WITHIN THE OFFICE, and will therefore NOT report sales where your agent was a buyers agent on a property listed by another office. For best results we recommend using the BROKER SALES DETAIL report BY AGENT (and then select all agents).
MLSChartsIf you have not already seen them there is a new set of reports available under the “RESOURCES” menu in Paragon called MLS CHARTS. These bring back two of the most popular List-It reports in terms of the Sales & Inventory History report and the Year-to-Year sales comparisons. (There are also a couple of new reports there too!). These rewrites of those reports give users more flexibility in applying a variety of new filters to the data to get very specific with your analysis.
NEW Subdivision Reports
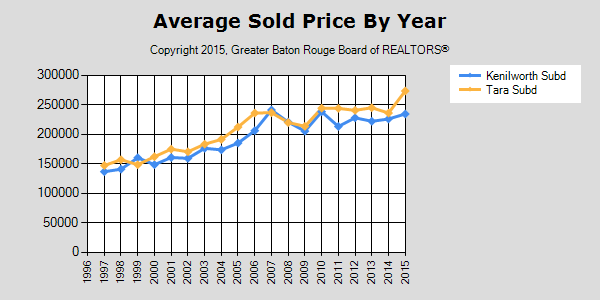
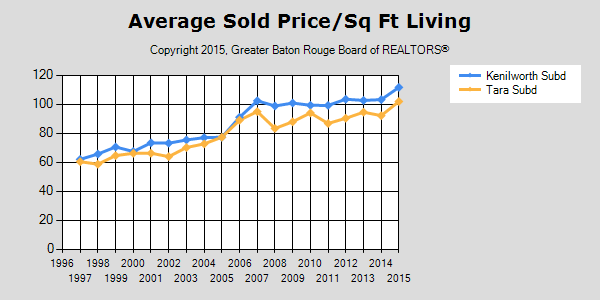
We have also released two new reports currently in BETA on the MLS that can also be accessed from the “RESOURCES” menu in Paragon. These are called SUBDIVISION TRENDS and SUBDIVISION REPORTS. Each of these reports allow users to take a long-term view of activity at the subdivision level. The SUBDIVISION TRENDS charts that information into images that can be saved like any other picture (see images below).
The SUBDIVISION REPORTS allows users to pick a subdivision, or series of subdivisions and view basic analytics for a multi-year period. With a single click these can then be broken down to annual numbers, which can then be broker down to individual sales. (This report must analyze LARGE sets of data and can take some time to generate — so please be patient!)